0%

avatar

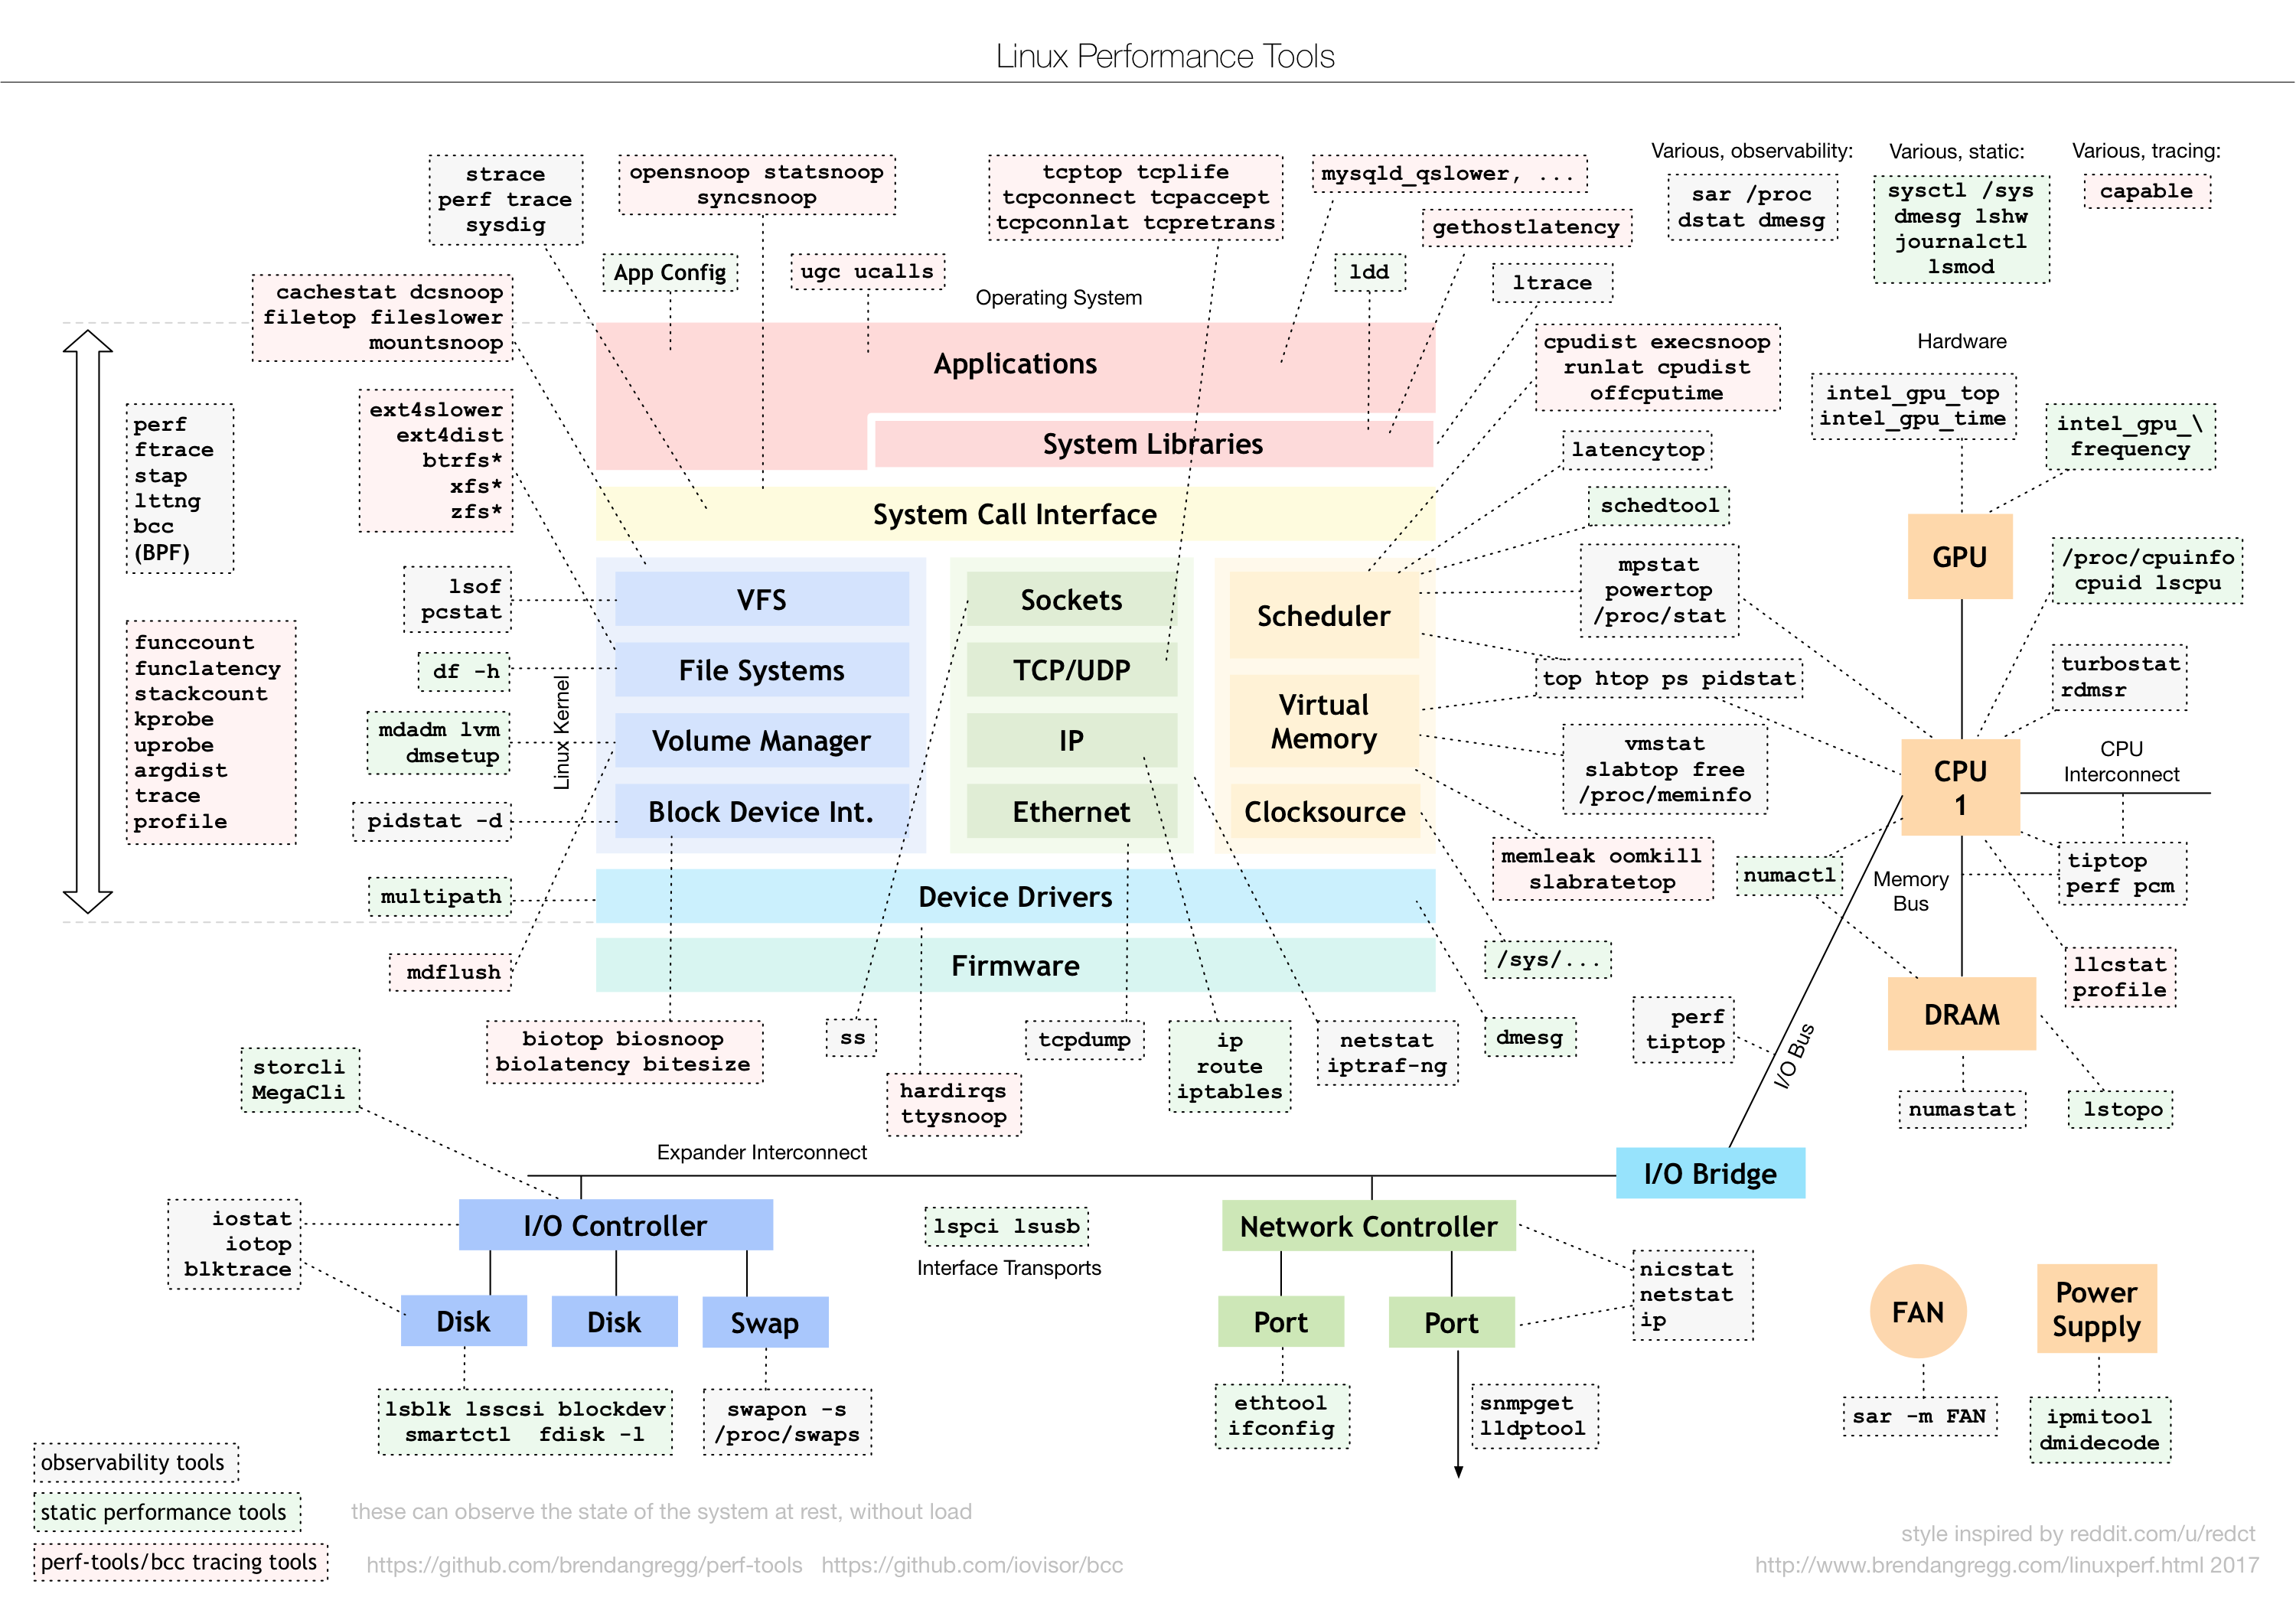
这个图是 Linux 性能分析最重要的参考资料之一,它告诉你,在 Linux 不同子系统出现性能问题后,应该用什么样的工具来观测和分析。

比如,当遇到 I/O 性能问题时,可以参考图片最下方的 I/O 子系统,使用 iostat、iotop、blktrace 等工具分析磁盘 I/O 的瓶颈。你可以把这个图保存下来,在需要的时候参考查询。

阅读全文 »

blah blah blah

blah blah blah

blah blah blah

这些样式出现在 Bootstrap 的官方文档中。

使用方式

Content (md partial supported)

Content (md partial supported)

阅读全文 »

1. 创建模板

1.1 模拟数据

1
2
3
4
5
6
7
8
9
10
11
12
13
14
15
16
17
user = {
'username': 'phimor',
'bio': 'A boy who loves movies and music.',
}

movies = [
{'name': 'My Neighbor Totoro', 'year': '1988'},
{'name': 'Three Colours trilogy', 'year': '1993'},
{'name': 'Forrest Gump', 'year': '1994'},
{'name': 'Perfect Blue', 'year': '1997'},
{'name': 'The Matrix', 'year': '1999'},
{'name': 'Memento', 'year': '2000'},
{'name': 'The Bucket list', 'year': '2007'},
{'name': 'Black Swan', 'year': '2010'},
{'name': 'Gone Girl', 'year': '2014'},
{'name': 'CoCo', 'year': '2017'},
]

uptime

1
16:45pm  up 614 days  1:31,  1 user,  load average: 2.53, 2.79, 3.18
  • 16:45pm : 当前系统时间
  • up 614 days 1:31 : 主机已运行时间,时间越大,说明你的机器越稳定
  • 1 user: 用户连接数,是总连接数而不是用户数
  • load average: 2.53, 2.79, 3.18 : 系统平均负载,统计最近1,5,15分钟的系统平均负载
阅读全文 »

在特定时间统计接口数

日志统计

代码

1
2
3
4
5
6
7
8
9
10
11
12
13
14
15
16
17
18
19
20
21
22
23
24
25
26
27
28
29
30
31
32
33
34
35
#!/bin/bash

HOST_NAME=$(hostname)
LOGS_DIR='/home/phimor/apache-tomcat-7.0.73/logs/'
LOG_FILE="localhost_access*"
INTERFACE_NAME='getToken'

START_TIME='2018-12-28 10:00:00'
END_TIME='2018-12-28 10:10:00'
start_time_seconds=$(date -d "${START_TIME}" +%s)
end_time_seconds=$(date -d "${END_TIME}" +%s)

get_seconds(){
seconds=$((${end_time_seconds}-${start_time_seconds}))
echo ${seconds}
}

count_gettoken_request_every_second(){
printf "请求时间\t\t\t请求数\t\t接口名\t\t\n"
while [[ ${start_time_seconds} -le ${end_time_seconds} ]]; do
#echo "output: ${start_time_seconds}"
#current_time=$(date -d "@${start_time_sesconds}" +"%F %H:%M:%S")
local current_time=$(echo "${start_time_seconds}" |awk '{print strftime ("%F %T",$0)}')
local second=$(echo "${current_time: -1}")
local search_time_regex="${current_time}${second}*"
#echo ${current_time}
#echo ${second}
#echo ${search_time_regex}
local gettoken_count=$(grep "${search_time_regex}" ${LOGS_DIR}${LOG_FILE} | grep ${INTERFACE_NAME} | wc -l)
echo -e "${current_time}\t\t${gettoken_count}\t\tgetToken"
true $(( start_time_seconds++ ))
done
}

count_gettoken_request_every_second > ${HOST_NAME}.txt

$$f(x) = a_1x^n + a_2x^{n-1} + a_3x^{n-2}$$


更新后没有了_custom文件夹和custom.styl文件啊,这个功能能不能增加到config里更新后没有了_custom文件夹和custom.styl文件啊,这个功能能不能增加到config里更新后没有了_custom文件夹和custom.styl文件啊,这个功能能不能增加到config里

阅读全文 »